

Enjoying our trade coverage? Add us as a preferred source on Google to catch breaking rumors first.
The NHL’s 2026-27 calendar puts the trade deadline at 3 p.m. ET on Monday, March 1, 2027, which gives general managers a little under 16 weeks to work out what their rosters are missing. On the league’s standings for Nov. 10, the defending champion Carolina Hurricanes sat at 14-3-2, with 30 points from 19 games and a plus-33 goal differential, six goals better than anyone else.
The odds board mostly agrees with the standings. In the futures table ESPN published on Nov. 5, Carolina was +600 to repeat, down from +650 on opening night, and no other club was shorter than +750. Those numbers will keep moving until March 1 and well beyond it. Some will move because teams win and lose. Others will move because a general manager picks up the phone.
This piece looks at what a futures price is made of and at the underlying numbers that make a few of them look out of step with the standings. None of it is a betting tip. Where the word value shows up here, it means the gap between a market price and a model, and the hockey research covered further down suggests the market usually wins that argument.
A +600 price carries 27 points of margin across the board
Start with the arithmetic. American odds of +600 mean a $100 ticket pays $600 in profit, so the break-even chance is 100 divided by 700, or 14.3 percent. Fractional prices convert the same way. New Jersey’s 11-1 works out to one chance in 12, which is 8.3 percent, and Boston’s 35-1 comes to 2.8 percent.
Now add up all 32 implied chances in ESPN’s Nov. 5 table. They total roughly 127 percent. Only one team can lift the Cup in June, so a fair book would sum to exactly 100, and the extra 27 points is the sportsbook’s margin, usually called the overround or the vig. It’s built into every price on the board, Carolina’s included, all the way down to the 1000-1 tags on Vancouver and Calgary.
Taking it out is simple if you’re willing to assume the margin is spread evenly. Divide Carolina’s 14.3 percent by 1.274 and you get about 11.2 percent, closer to one chance in nine than one in seven. The even spread is an assumption made for convenience. Books are free to load more margin onto some teams than others, and nothing in the published table shows where they did.
Boston’s price shortened from 100-1 to 35-1 in a month
The Bruins were an afterthought in June. CBS Sports’ table from June 15 priced Boston between +6000 and +10000 across four books. The +6000 came from the same book whose numbers ESPN later printed, and by opening night that book had pushed the Bruins out to 100-1, about a 1 percent chance before the margin comes out.
Then Boston started winning. ESPN’s Nov. 5 table had the Bruins at 35-1, a price that nearly tripled their implied chance to 2.8 percent in about four weeks of hockey. On the NHL’s Nov. 10 standings they were 13-4-1 with 27 points in 18 games, and their plus-27 goal differential trailed only Carolina’s.
The same ESPN table shows prices drifting the other way. Florida came into the season as a co-favorite at +650 and had lengthened to +900 after a 9-5-2 start, while Carolina’s number shortened from +650 to +600. Early in a season, futures track the standings closely, sometimes more closely than the underlying play deserves.
Whether that reflects the books reading the hockey or managing the tickets they’ve written, the table can’t say. Boston’s offseason pushed its price longer, and one hot month pulled it back past where it had been in June.
One goalie trade cut New Jersey’s price from 25-1 to 14-1
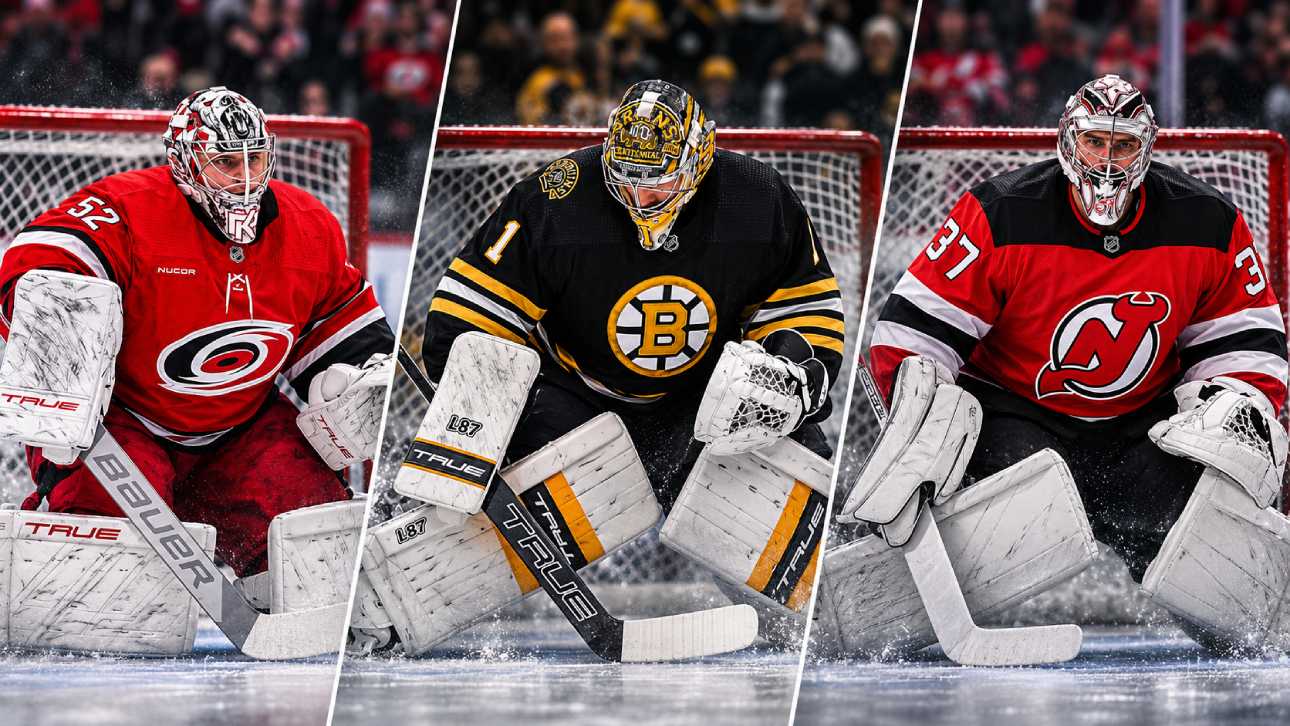
New Jersey opened the season at 30-1 and had come in to 25-1 before the trade, according to ESPN’s Nov. 5 odds story. On Oct. 23 the Devils sent Dawson Mercer, Nick Bjugstad, Alexander Command, Nico Daws and two draft picks to Winnipeg for Connor Hellebuyck, per the club’s release on NHL.com. ESPN reported that the price shortened from 25-1 to 14-1 once the deal was done, and by Nov. 5 it stood at 11-1.
In probability terms the trade took the Devils from about 3.8 percent to 6.7 percent. The weeks of hockey before it had moved them by less than a point. Hellebuyck arrived with three Vezina Trophies and a Hart Trophy on his record, and through his first five starts in New Jersey he was 5-0-0 with a .913 save percentage, per the NHL’s stats. Jake Allen, still New Jersey’s other starter, sat at .881.
It’s hard to name another position where one arrival shifts a contender’s price that far. A top-line forward takes his shifts and sits; a starting goalie faces every shot while he’s in net. The hole was real, too. Allen’s .881 is what New Jersey would otherwise be leaning on.
Deadline day can produce the same kind of jump for a contender that fills a gap in net. It can also produce nothing at all, if the player who moves is no better than the one he replaces.
Shot share says Boston’s record is running ahead of its play
Goal differential is the first thing anyone checks, and it’s a fair starting point. It also blends two very different things: how much of the play a team controls, and how well its shooters and goalies are converting. Pulling those apart is where a futures price can start to look out of line.
Carolina passes both tests. Through Nov. 10 the Hurricanes had taken 632 shots and allowed 426, about 60 percent of the shots in their games according to the NHL’s team stats. They were scoring on 12.3 percent of them, not far above the league-wide 11.45 percent. A plus-33 built mostly on volume is the kind a model believes.
Boston’s plus-27 looks different underneath. The Bruins had been outshot 509 to 482, a 48.6 percent share, while scoring on 13.9 percent of their shots. Jeremy Swayman (.920 in 13 starts) and Michael DiPietro (.925 in five) were stopping nearly everything. Teams that win while being outshot need both percentages to hold, and over the 64 games Boston has left, percentages like those tend to drift back toward league norms.
Expected-goals share, written xGF%, goes a step further by weighting each shot for where and how it was taken. The raw count already tells the Boston story, though. A model built on shot share would price the Bruins longer than their record does, and one built on goal differential would price them shorter. ESPN’s 35-1 looks like a compromise between those two readings, though no published model puts a number on either one.
Who starts in net decides series and goalie markets alike
Carolina’s own title run showed how much rides on the crease. The Hurricanes went 16-3 in the 2026 postseason and opened and closed it with shutouts. They won the Cup in Game 6 behind Brandon Bussi, who made 22 saves in just his third career playoff start, according to CBS Sports.
The same question shapes the nightly markets. On Nov. 10 the Devils started Allen in Winnipeg and left Hellebuyck on the bench for his first visit since the trade. Coach Sheldon Keefe pointed to three games in six nights after a missed training camp, as this site reported that day. The Jets won 4-2. Any market written on Hellebuyck’s saves that night depended on a lineup call made hours before puck drop.
“Goalie Must Start” is how the terms of Shuffle, a bitcoin sportsbook, label its NHL goalie markets, which on a plain reading means the named goalie has to start the game. Prop settlements, under the next clause, come from official league data in the box scores, and nhl.com is the hockey site on that list.
Nobody located or living in the United States is allowed in under those terms, and no Canadian province has licensed or registered the site. Hockey people will recognize the problem the clause is written around. A Cup price assumes a goalie plan for April and May, while a goalie market assumes a start on one night, and a coach can upend either one on the morning of a game.
An old NHL betting bias vanished within a decade
Researchers Linda and Bill Woodland tested whether NHL betting lines could be beaten in two papers published a decade apart. Their earlier work found that underdogs were underbet strongly enough to allow profitable wagering. Their 2011 follow-up in the Journal of Sports Economics studied ten more seasons of NHL betting. The bias held for the first three, then disappeared over the last seven as the market converged to efficiency.
That research covered game lines, not season-long futures, so it can’t prove any Cup price is right. It does suggest that an edge visible from the standings gets noticed and closed. Futures add costs of their own on top of that. The margin from earlier never leaves the price, and the stake stays tied up until April 10 on a regular-season market, or as late as June 19 on the Final.
Even a fair price on the favorite loses most of the time. If Carolina’s real chance is the 11.2 percent left once the margin is removed, a Carolina ticket fails about eight times in nine. Nobody knows the real number. A model can disagree with the market, but the disagreement has to be bigger than the margin before it means anything, and it has to survive five more months of hockey.
None of this makes the market perfect. Boston’s 100-1 on opening night looks badly wrong after 18 games, and nobody will know for sure until spring.
March 1 asks one question of every contender
The standings can’t say what a price will do next, but they can show where a contender is thin. Carolina’s thin spot is the second goalie. Pyotr Kochetkov was 11-1-0 with a .920 save percentage through Nov. 10, while Bussi, the Game 6 hero, sat at .869 across seven starts, per the NHL’s stats. One injury in April would put the weaker number in the crease.
The goalie market looks thin too. Jordan Binnington is the name in the rumor mill, and this site’s look at Binnington trade chatter after Friedman’s report laid out the problem. Elliotte Friedman said on Nov. 7 he was “starting to hear some noise.” Binnington, though, was 1-3-1 with an .851 save percentage through five starts, and he carries a $6 million cap hit with a 10-team no-trade list. The Rangers, who lost Igor Shesterkin for the season, have their own reasons to shop in that aisle.
Boston’s question is a different one. Being outshot isn’t a hole one player fills, and it’s hard to see a single deadline trade turning a 48.6 percent shot share into a dominant one.
So before any price moves, a fan can answer one thing from the standings alone. Does this contender’s weakness have a fix on the market, and is that fix better than what’s already in the lineup? The deadline closes at 3 p.m. ET on March 1, and by then every contender on the board will have answered it, one way or the other.